

What you’ll learn in this article…
- Vermont, California, Massachusetts, New Jersey, and Hawaii rank as the five strongest teacher union states in the 2026 Fordham report.
- Median teacher salaries in the top five union states exceed those in the five weakest states by roughly $15,000 to $25,000.
- States with robust collective bargaining laws report measurably lower teacher turnover, saving districts significant recruitment and training costs.
- Since the 2018 Janus ruling and the growth of school choice, union membership has declined in 46 states even as bargaining coverage persists.
Teacher union strength in 2026 varies more by state than teacher pay itself. Vermont ranks first in union power, Arkansas last, and the gap between them shapes every dimension of a teaching career: salary floors, grievance protections, class size caps, and job security during district restructuring. A teacher in California operates under collective bargaining agreements negotiated by one of the nation's most resourced unions, while a teacher in Oklahoma works in a state where unions lack statutory bargaining rights entirely.
The Fordham Institute released the most comprehensive ranking of teacher union strength in May 2026, scoring all 50 states and D.C. across 59 measures covering membership, political spending, bargaining policy, legislative wins, and perceived influence. The report isolates which states offer union-backed career stability and which leave teachers negotiating as individuals.
For M.Ed. candidates weighing job markets and educators considering relocation, union strength is now a documented variable with measurable salary and retention effects. The strongest union states cluster in the Northeast and West Coast, the weakest across the South and parts of the Mountain West, and the career implications of that geography are no longer anecdotal.
What the 2026 Fordham Report Reveals About Teacher Union Strength
Measuring union power has always been contested territory, and a new report released in May 2026 offers the most systematic attempt yet to map it across all fifty states.1
The Research Team and Why It Matters
Released on May 27, 2026, the Fordham Institute study was authored by Melissa Arnold Lyon of the University at Albany, Sandy Frost Waldron as an independent researcher, and Rebecca Jacobsen of Michigan State University. The combination of academic rigor and institutional credibility gives the findings weight that advocacy-driven rankings typically lack. Rather than producing a single composite score, the researchers set out to capture what union strength actually means in practice, not just on paper.
A Framework Built on Five Domains
The study evaluated unions across 59 distinct measures organized into five areas:
- Resources and Membership: Financial capacity and the size of the dues-paying base.
- Involvement in Politics: Electoral activity, lobbying expenditure, and candidate endorsements.
- Labor and Bargaining Policies: State laws governing collective bargaining rights, scope of negotiation, and dispute resolution.
- Policy Wins and Losses: Outcomes on legislation and ballot measures that unions supported or opposed.
- Perceived Influence: Survey-based assessments of how much sway unions actually hold in education policy conversations.
This multi-domain approach matters because a state can score differently across dimensions. A state with a shrinking membership base may still rank highly if its bargaining rights are broad and its political wins are consistent. Raw headcounts tell only part of the story.
The Perceived-Influence Domain
Perhaps the most distinctive feature of the study is its stakeholder survey, conducted with K-12 participants across all 50 states and Washington, D.C. Perceived influence captures reputation and soft power: the degree to which policymakers, administrators, and educators themselves believe unions shape decisions. Hard data on contracts and finances cannot measure whether a union is seen as a force to be reckoned with. This survey layer fills that gap. For professionals in careers for masters in education, understanding these dynamics is especially relevant when evaluating prospective employers and school systems.
For educators weighing career moves or policy engagement, understanding how union strength is constructed, not just where states rank, is the essential starting point. Those considering a teacher leadership degree will find that union landscapes directly shape leadership opportunities at the building and district levels. The full methodology is available from the Fordham Institute.
Strongest and Weakest Union States: The 2026 Rankings
The 2026 Fordham Institute report ranked teacher union strength across all 50 states and D.C. using 59 measures spanning five categories: Resources and Membership, Involvement in Politics, Labor and Bargaining Policies, Policy Wins and Losses, and Perceived Influence. The gap between the strongest and weakest union states is dramatic, with direct implications for teacher pay, working conditions, and career stability. Below are the top five and bottom five states identified in the study.
| Rank | State | Union Tier | Collective Bargaining Rights | Notable Strength or Weakness |
|---|---|---|---|---|
| 1 | Vermont | Strongest | Full collective bargaining rights | Ranked highest overall across multiple union strength dimensions |
| 2 | California | Strongest | Full collective bargaining rights | Strong union political involvement and high membership density |
| 3 | Massachusetts | Strongest | Full collective bargaining rights | Consistently high marks for policy wins and perceived influence |
| 4 | New Jersey | Strongest | Full collective bargaining rights | Deep union resources and strong bargaining protections for educators |
| 5 | Hawaii | Strongest | Full collective bargaining rights | Statewide single district structure amplifies union bargaining leverage |
| 46 | Arkansas | Weakest | Limited or no collective bargaining | Minimal union political influence and low membership rates |
| 47 | Oklahoma | Weakest | Limited or no collective bargaining | Weakened labor policies and low perceived union influence statewide |
| 48 | Tennessee | Weakest | Limited or no collective bargaining | State law restricts collective bargaining for public school teachers |
| 49 | North Carolina | Weakest | No collective bargaining for public employees | Among the most restrictive states for teacher union activity |
| 50 | Mississippi | Weakest | No collective bargaining for public employees | Lowest overall union strength ranking, with minimal policy wins |
How Union Strength Affects Teacher Salaries by State
States where teacher unions rank among the strongest in the 2026 Fordham report consistently show higher median teacher pay, according to Bureau of Labor Statistics wage data. California, Massachusetts, and New Jersey, all top five in union strength, report median salaries well above states at the bottom of the rankings. However, correlation is not causation: cost of living, state budget capacity, and teacher supply also shape compensation. Even within strong union states, the spread between 25th and 75th percentile salaries can exceed $30,000, meaning individual outcomes vary significantly based on experience, district, and credentials.
| State | Union Strength Rank (Fordham 2026) | Elementary Teacher Median Salary | Elementary 25th Percentile | Elementary 75th Percentile | Secondary Teacher Median Salary | Secondary 25th Percentile | Secondary 75th Percentile |
|---|---|---|---|---|---|---|---|
| California | Top 5 (Strongest) | $98,190 | $74,940 | $107,020 | $98,710 | $76,870 | $122,350 |
| Massachusetts | Top 5 (Strongest) | $83,260 | $64,000 | $99,100 | $88,990 | $76,650 | $99,590 |
| New Jersey | Top 5 (Strongest) | $77,150 | $62,710 | $97,380 | $80,440 | $73,140 | $98,950 |
| New York | Strong | $82,480 | $63,550 | $128,000 | $98,370 | $76,290 | $129,790 |
| Connecticut | Strong | $78,740 | $60,860 | $98,620 | $77,270 | $60,440 | $98,500 |
| Ohio | Moderate | $65,380 | $50,060 | $79,270 | $76,740 | $59,840 | $94,810 |
| Pennsylvania | Moderate | $74,160 | $59,680 | $79,730 | $77,990 | $60,700 | $91,660 |
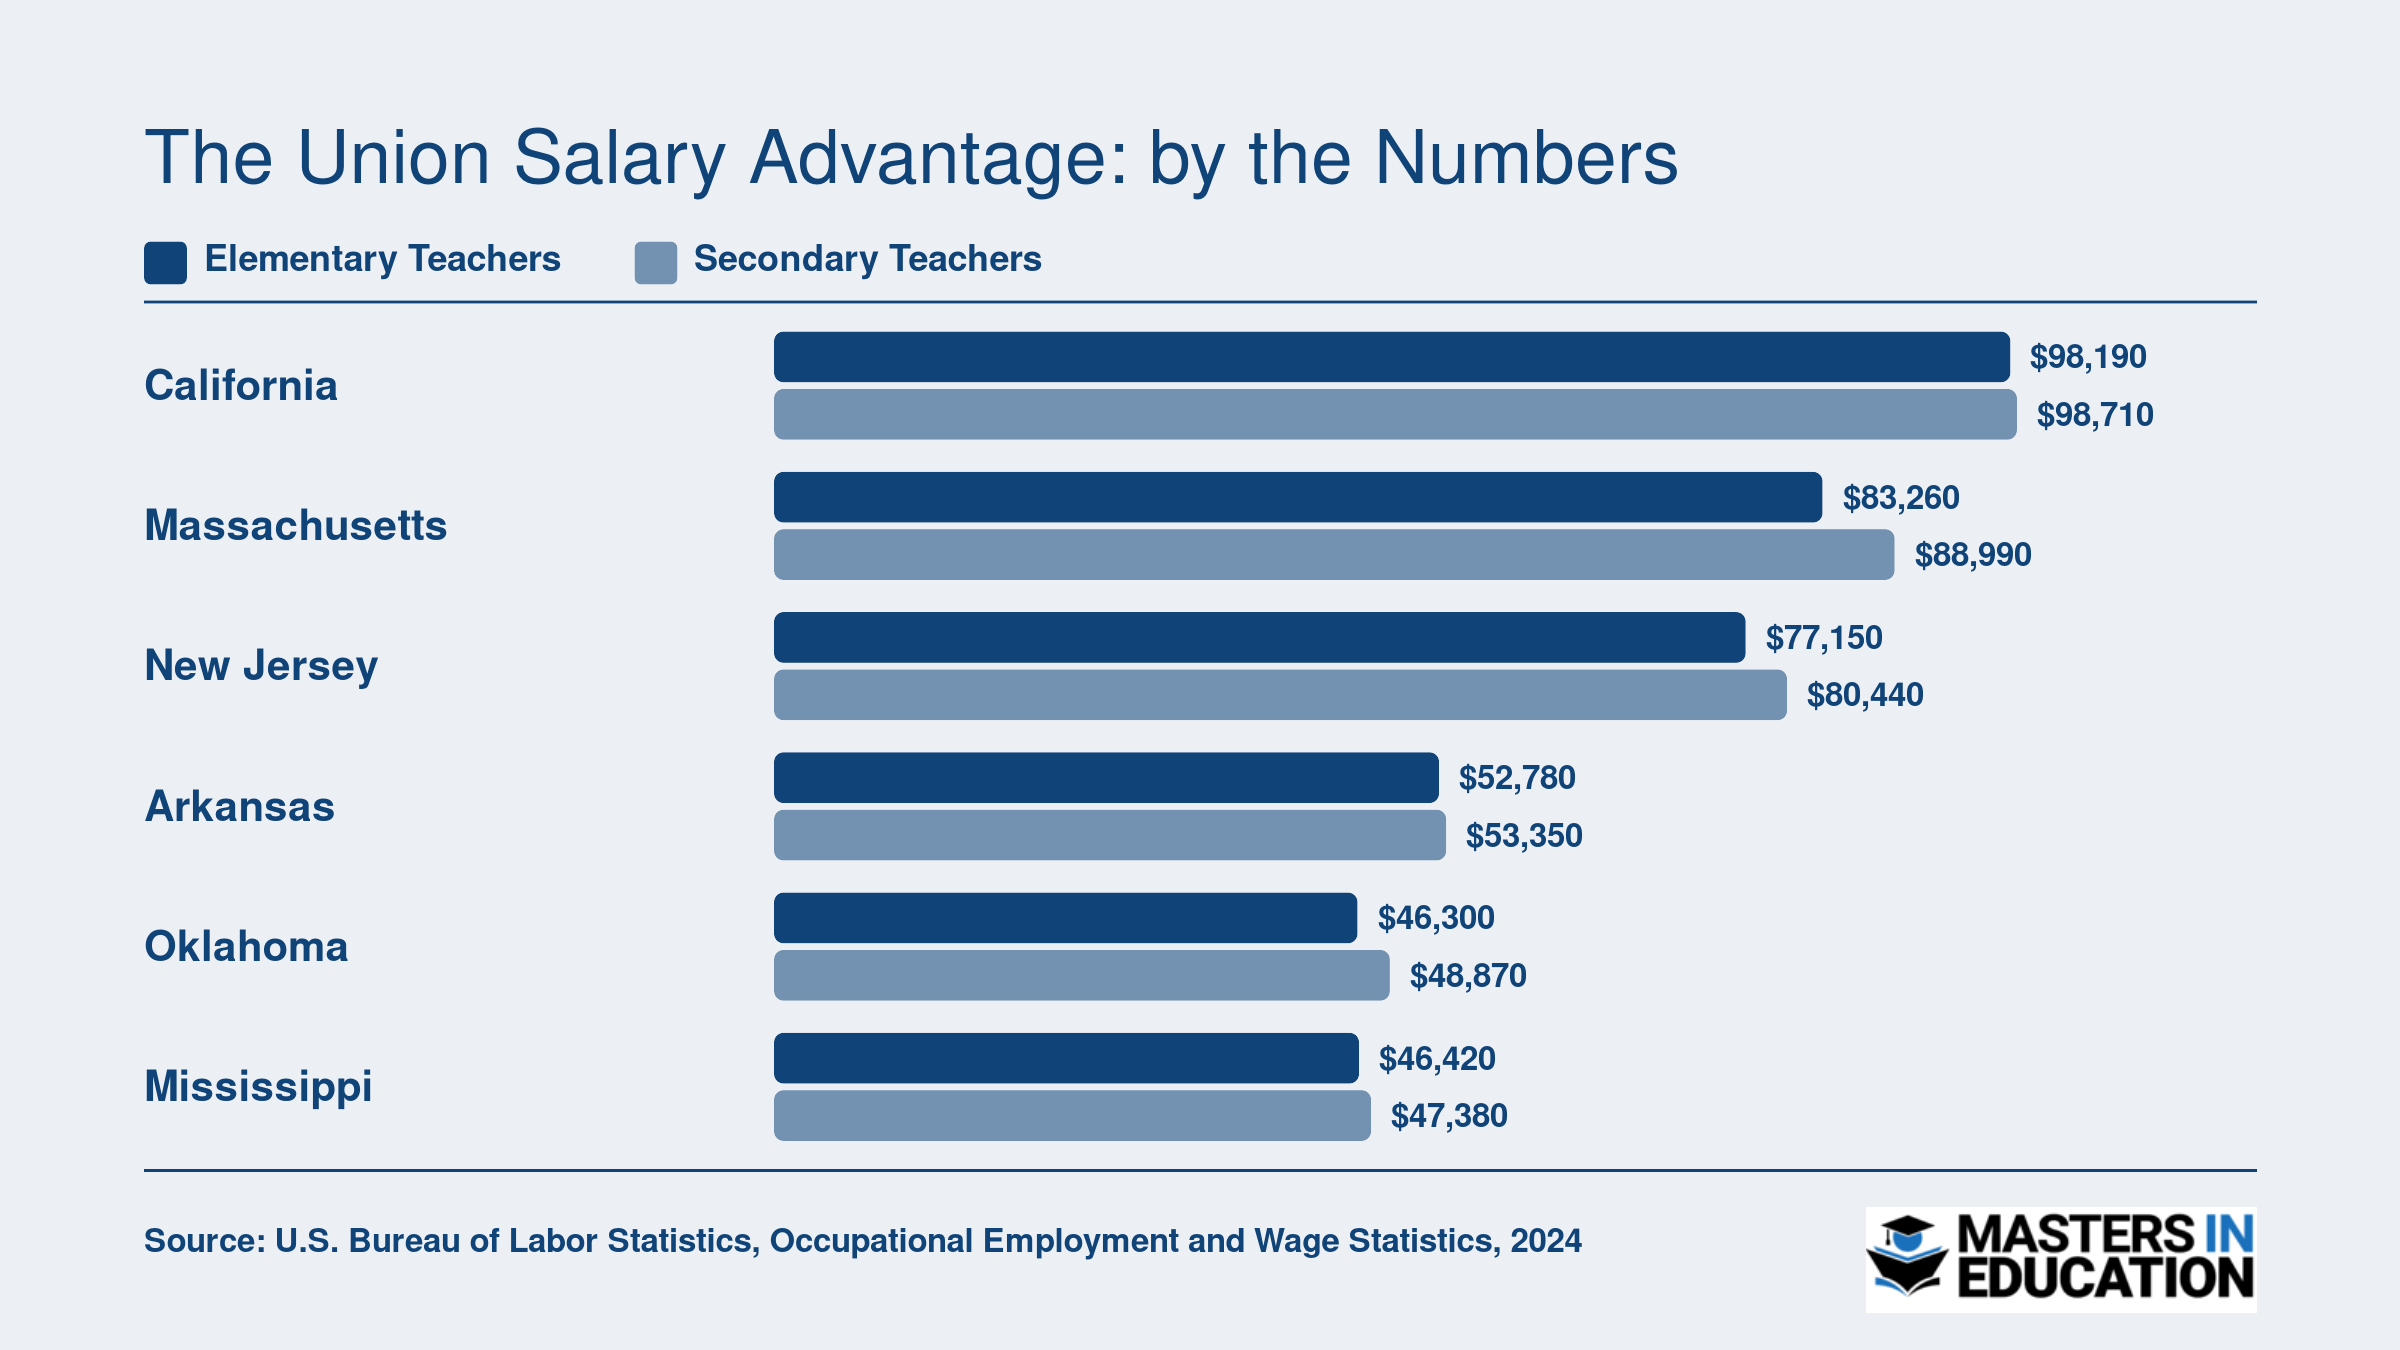
The Union Salary Advantage: By the Numbers
Teacher pay varies dramatically between states with the strongest and weakest union presence. Across the five strongest union states identified in the 2026 Fordham report (Vermont, California, Massachusetts, New Jersey, and Hawaii), median salaries for both elementary and secondary teachers consistently outpace those in the five weakest union states (Arkansas, Oklahoma, Tennessee, North Carolina, and Mississippi). The BLS figures below compare available median salaries in three of the top-ranked strong-union states against three weak-union states, highlighting a gap that often exceeds $20,000 per year. Cost of living does differ across these states, so educators should weigh purchasing power alongside raw salary figures.
Union Strength, Teacher Retention, and Working Conditions
For educators evaluating where to build a long-term career, the tradeoff between job protections and workplace flexibility often hinges on local union strength. States with robust collective bargaining laws report lower turnover, while those with weaker unions see teachers exiting the profession faster. Understanding how these dynamics affect daily working conditions is central for M.Ed. candidates mapping out a sustainable career.
Retention Data Across Union and Right-to-Work States
Nationally, teacher turnover reached 15.1% in the 2021-2022 school year, with an exit rate of 7.1% and another 8.0% moving between schools.1 This represents a 27% increase since the early 1990s. However, the averages mask steep geographic variation. In states where union membership rates top 90%, such as California, Massachusetts, and New Jersey, attrition tends to fall below the national rate.2 By contrast, right-to-work states like North Carolina and Tennessee, where membership hovers near 60%, consistently report higher churn. Reports from the Learning Policy Institute and state education agencies affirm that collective bargaining coverage, not just membership, correlates with reduced mobility.
How Contracts Shape the Classroom Experience
Union contracts typically govern the non-salary elements that teachers cite as top reasons for staying: manageable class sizes, guaranteed preparation time, clear grievance procedures, and seniority-based job security. When these protections are codified, teachers report a measurable drop in stress. A 2022-2024 analysis found that the presence of a collective bargaining agreement was associated with a 0.07 standard deviation reduction in teacher stress scores, equivalent to a 14% decrease relative to the variance in the data.3 This cushion allows teachers to focus on instruction rather than navigating arbitrary administrative decisions.
The Flip Side: Rigidity and Perceptions of Protections
Critics point out that strong seniority protections can lock in underperforming teachers, making it harder for schools to build cohesive teams. In districts with rigid last-in-first-out layoff policies, newer educators, who often bring fresh methods and energy, are the first to go during budget cuts. This can create a working environment where innovation is stifled and morale dips among junior staff. The same contracts that protect veteran teachers may inadvertently push talented beginners into early exits if they feel their growth is capped.
Burnout Risk for M.Ed. Graduates in Weak-Union States
For those entering the profession with a master's degree, the calculus is especially stark. Teachers in weak-union states face higher burnout risk and faster career exits, often within the first five years. Without enforceable limits on overtime, class sizes, or evaluation processes, the job becomes unsustainable for many. Educators considering M.Ed. programs by state should factor union climate into their planning. Wisconsin offers a dramatic case: after Act 10 curtailed collective bargaining in 2011, union membership plummeted from 98% to 45% by 2025, and exit rates climbed.4 The loss of contract protections correlated with rising dissatisfaction and departures across the state.
Post-Covid Dynamics and Scrutiny
Pandemic-era school closure debates amplified public scrutiny of union influence on working conditions. In strong-union states, extended remote learning periods led to frustration among parents and some teachers who felt the priorities shifted away from student needs. Yet the same unions later negotiated safety protocols that many educators cited as essential to their willingness to return. This renewed visibility has made union strength a salient factor in career decisions, as teachers increasingly weigh their voice in policy decisions against the broader political climate.
Replacing a single teacher costs school districts an average of $25,000 according to the Learning Policy Institute. This includes expenses for recruiting, hiring, and training new staff, plus the productivity loss during transitions. In states with weaker union protections and lower retention rates, these costs compound rapidly, draining resources from classrooms.
Key Forces Reshaping Union Power: From Janus to School Choice
Teacher union power does not exist in a vacuum. Over the past fifteen years, a series of legal decisions, legislative actions, and policy shifts have fundamentally changed the environment in which unions operate. Understanding those forces helps educators read the current landscape with clearer eyes.
The Janus Ruling and Its Financial Fallout
In 2018, the Supreme Court's decision in Janus v. AFSCME made it illegal to require public employees, including teachers, to pay union fees as a condition of employment. Before that ruling, unions could collect "agency fees" from workers who chose not to join, covering the cost of collective bargaining on their behalf. Overnight, that revenue stream disappeared.
The numbers tell a real story. The National Education Association had roughly 87,000 agency fee payers in 2016, 2017; by 2018, that figure dropped to zero.1 Between 2017 and 2022, the NEA lost more than 203,000 working members, with dues revenue falling from approximately $370 million to $310 million, a decline of about 16 percent in inflation-adjusted terms.2 The American Federation of Teachers followed a similar trajectory, losing roughly 125,000 working members over the same period and seeing dues revenue drop from about $197 million to $180 million, an inflation-adjusted decline of around 9 percent.2
Combined, the two national teacher unions lost nearly 734,000 working members between 2017 and 2022.2 In response, both organizations leaned into opt-in campaigns and value-added services, expanded member outreach, and sharpened their identity around broader social and community issues.3 The AFT recorded 11 new organizing wins in 2022 alone, suggesting that active recruitment can offset some losses, though the financial gap remains significant.4
Wisconsin as a Legislative Case Study
Janus was a court ruling; Wisconsin Act 10 in 2011 was a legislative counterpart. The law stripped most public employees, including teachers, of meaningful collective bargaining rights. Wisconsin's standing in the 2026 Fordham rankings reflects consequences that are still playing out more than a decade later. What happened in Wisconsin demonstrated that union power can be curtailed quickly through state legislation, a lesson that educators in states with more conservative legislatures should not ignore. For teachers weighing graduate study options in the state, exploring master's in education programs Wisconsin can provide context on how local institutions address these policy realities.
ESSA, School Choice, and a Crowded Policy Table
The Every Student Succeeds Act, passed in 2015, moved education authority away from the federal government and back toward states. In strong-union states, that shift handed unions more direct leverage over policy. In weak-union states, it removed a layer of federal protection that had previously diluted state-level anti-union politics.
At the same time, the school choice movement has steadily eroded the traditional public school enrollment base through charter expansion and voucher programs. Fewer students in traditional public schools means fewer unionized teaching positions, which shrinks the membership pool unions depend on.
Compounding all of this is the rise of competing advocacy organizations. The Policy Innovators in Education Network grew from roughly 30 member groups in 2012 to more than 180 today. These organizations, which tend to favor market-based reforms, now occupy significant space at the education policy table that unions once dominated largely on their own. For educators trying to understand who shapes the conditions of their profession, recognizing that this table has become genuinely crowded is a practical starting point.
Related Articles
Do Teacher Unions Improve Student Outcomes?
Advocates point to higher graduation rates and more stable classrooms; critics counter with flat test scores and tenure protections that shield underperformance. The honest answer, drawn from decades of peer-reviewed research, is that the evidence is genuinely mixed, and how you interpret it depends on which outcomes you measure.
The Case for Positive Effects
Several studies examining unionized districts have found modest but real correlations with improved completion metrics. Research published in the *Economics of Education Review* found that states with stronger union presence saw graduation rates roughly 4.4 percentage points higher than weaker-union states during the period studied, alongside dropout rates about 2.3 percentage points lower.1 The proposed mechanism is straightforward: unions negotiate higher salaries (about 5 percent more than non-union counterparts, on average) and smaller class sizes, with student-teacher ratios 7 to 12 percent lower in unionized districts.2 Better-compensated, more stable teaching workforces tend to stay longer, build institutional knowledge, and maintain the continuity that students, especially those in high-poverty schools, need. For a broader look at how advanced credentials affect masters in education salary, compensation data reinforces the value of both union membership and degree attainment.
On standardized assessments, the picture is far less dramatic. Some analyses of union-era data found test-score gains in the range of 0.02 to 0.04 standard deviations, a real but very small effect that most parents and policymakers would struggle to notice in practice.
The Counter-Evidence
Natural experiments tell a more complicated story. After Wisconsin's Act 10 curtailed collective bargaining for public employees in 2011, researchers tracked student performance expecting improvement from the removal of union constraints. Instead, math scores declined by roughly 0.03 to 0.05 standard deviations, and reading scores dipped by a slightly smaller margin.4 That finding complicates the anti-union narrative, but it does not settle the debate. National-level analyses have produced effect sizes ranging from near-zero to modestly negative (around negative 0.02 to negative 0.05 standard deviations), suggesting that union strength by itself is not a reliable predictor of higher test scores.5 Some research also found distributional effects: average-performing students showed slight gains in unionized districts, while both the lowest and highest achievers fared somewhat worse.
Critics also raise structural concerns. Tenure and seniority protections embedded in many union contracts can make it harder to remove consistently low-performing teachers, a factor that may partially offset the retention benefits unions provide.
The Equity Question
One area where unions show a clearer track record is within-district salary compression. Collective bargaining tends to reduce pay gaps between the highest- and lowest-paid teachers in a district, which can help recruit and retain educators in hard-to-staff schools. Professionals interested in advancing equity goals may also explore roles like diversity and inclusion coordinator, where understanding systemic pay structures is essential. However, when researchers look at whether union strength narrows student achievement gaps across racial and socioeconomic groups, the effects are minimal, generally less than 0.05 standard deviations.2 States that prohibit collective bargaining have, in some cases, found alternative engagement strategies that produce comparable or slightly better equity outcomes, with effect sizes of 0.02 to 0.05 standard deviations.6
What This Means for Your Career Planning
The most useful takeaway for educators evaluating the 2026 Fordham rankings is this: union strength affects inputs more reliably than outputs. Pay, benefits, class sizes, job protections, and working conditions all tend to be measurably better in strong-union states. Whether those advantages translate into higher student test scores depends on a web of factors, including state funding formulas, district administration, curriculum quality, and community demographics, that no single policy lever controls.
If you are deciding where to teach or whether to pursue an M.Ed. in a particular state, treat union strength as a signal about your professional environment rather than a guarantee about student results. Strong unions tend to mean stronger floors under compensation and working conditions. That stability matters for career longevity, even if the research cannot draw a straight line from union membership cards to standardized test gains.
What This Means for Educators Choosing Where to Teach
Which states should teachers prioritize when union strength matters to their career goals?
The answer depends on what you value most. Union strength is a significant factor in shaping your teaching career, but it is one variable among several that deserve careful consideration before relocating or accepting a position.
Building Your Career Decision Matrix
Rather than viewing union strength in isolation, treat it as one dimension of a five-factor framework:
- Union strength: Determines collective bargaining power, job security mechanisms, and advocacy infrastructure
- Salary levels: Varies dramatically by state, with strong-union states typically offering higher pay floors
- Cost of living: A $75,000 salary in Mississippi stretches further than in California
- Job availability: Teacher shortages create opportunities but also signal potential working condition challenges
- Personal geography: Family ties, climate preferences, and community fit matter for long-term career satisfaction
M.Ed. candidates who prioritize salary trajectory and contractual job security will find stronger protections in states like Vermont, California, Massachusetts, New Jersey, and Hawaii. These states offer established grievance procedures, negotiated salary schedules with clear advancement steps, and robust benefit packages secured through collective bargaining agreements.
The Case for Weaker Union States
Teachers who prefer professional flexibility may find advantages in states where unions hold less sway. Arkansas, Oklahoma, Tennessee, North Carolina, and Mississippi sometimes offer performance-based compensation structures, faster pathways to leadership positions, and greater school-level autonomy in curriculum decisions.
If you are entrepreneurial, interested in charter school environments, or want differentiated pay tied to student outcomes or specialized skills, these states may align better with your professional philosophy. The trade-off is fewer collective protections if disputes arise with administrators.
Union Leadership and Activism Opportunities
For educators who want to serve in union leadership roles or engage actively in education policy advocacy, state context matters enormously. Strong-union states provide established infrastructure: local chapters with dedicated staff, professional development for union representatives, and direct pathways to influence legislation. Vermont, California, and Massachusetts offer the most developed ecosystems for teachers seeking policy engagement beyond the classroom.
In weak-union states, fewer organizational resources exist for teachers who want to advocate collectively. This does not make activism impossible, but it requires more individual initiative and grassroots organizing.
Your Pre-Relocation Checklist
Before making a geographic career decision, complete this analysis:
- Cross-reference the Fordham union strength rankings with Bureau of Labor Statistics state salary data for teachers
- Calculate cost-of-living adjustments using tools like the MIT Living Wage Calculator to compare purchasing power across states
- Research specific district salary schedules, not just state averages
- Identify whether your target state has collective bargaining rights for teachers or operates under right-to-work laws
- Assess your own priorities: Do you value security or flexibility more highly?
The strongest career decisions emerge from honest self-assessment combined with objective data. Exploring M.Ed. degree jobs can help you understand which roles benefit most from union protections, and reviewing teaching licensure with a master's degree ensures you meet requirements in your target state. Union strength is a meaningful signal about your future working conditions, but only when interpreted alongside the full picture of what makes a teaching position sustainable for you.
Questions to Ask Yourself
Looking Ahead: The Future of Teacher Unions Beyond 2026
In 46 states, teacher union membership rates have fallen since 2012, yet collective bargaining still covers 90% of educators in the 10 strongest union states.1 That gap between membership density and real bargaining power is just one of several trends likely to reshape the landscape for education professionals through 2030 and beyond.
Structural Headwinds: School Choice, Janus Fallout, and a Crowded Advocacy Field
The growth of school choice programs remains a central pressure on union influence. As charter networks, voucher initiatives, and education savings accounts continue to expand, the traditional public school sector, where unions draw most members, shrinks proportionally. The Policy Innovators in Education Network has grown from roughly 30 advocacy groups in 2012 to more than 180 today, pulling policy attention in directions that often compete with union priorities.1
Demographic shifts add another layer. A wave of retirements among long-tenured members is reshaping union locals, while newer, less unionized teachers, many from alternative certification programs, show weaker attachment to collective bargaining traditions. Even in historically strong states like Wisconsin, the effects are dramatic: membership density dropped from 98% in 2012 to 45% in 2025, a decline accelerated by Act 10 and sustained by the Janus v. AFSCME decision, which ended mandatory agency fees in 2018.2
State-by-State Trajectories: Where Strength Will Hold, Slip, or Shift
Not all states will follow the same path. In the Northeast and West Coast, where legislatures actively protect bargaining frameworks, union strength is likely to remain high. Vermont, California, Massachusetts, New Jersey, and Hawaii, the five strongest union states in the 2026 Fordham Institute ranking, show little sign of major policy rollbacks.1 In the South and parts of the Midwest, however, erosion appears likely to continue. States like Arkansas, Oklahoma, Tennessee, North Carolina, and Mississippi already sit at the bottom of the national strength index and face ongoing pushes for right-to-work expansions and charter growth.
The middle tier is where the most dramatic changes may unfold. Wisconsin's fall from a ranking of 18th in 2012 to 36th in 2026 offers a preview: a single legislative act can undermine union capacity even when union-endorsed candidates win 70% of subsequent elections, as happened in 2024.2 Analysts suggest that states with divided government or shifting partisan control could resemble Wisconsin's trajectory, while those with durable pro-union majorities will likely hold steady.
Wildcards: Federal Policy, the Courts, and Independent Advocacy
Federal direction remains unpredictable. A change in party control could accelerate or reverse guidance around Every Student Succeeds Act compliance, potentially altering how states approach teacher bargaining. Meanwhile, the Supreme Court has signaled openness to new cases on public-sector union organizing, and a ruling that further limits exclusive representation or member opt-in rules would accelerate membership declines nationwide.
Outside traditional union structures, independent teacher advocacy groups, using social media and local organizing, are filling gaps. These networks often bypass formal bargaining but still shape working conditions, pressuring districts through public campaigns. Their rise could dilute union influence while rechanneling teacher voice into less formal, more issue-specific arenas.
The AI and Ed-Tech Dimension
Automation of administrative tasks, AI-driven personalized learning platforms, and the growth of full-time virtual schools may reshape the teacher workforce in ways the 2026 Fordham report cannot yet capture. Educators considering roles such as e-learning designer should note that if schools adopt technology reducing staffing ratios or altering the employee-employer relationship (for example, contracting with remote instruction providers), the composition of union-eligible roles could shift. A workforce with more part-time, adjunct-like positions may prove harder to organize, even as traditional classroom teachers remain the backbone of union locals.
An Empowering Outlook for Educators
For teachers and M.Ed. graduates, these trends do not signal powerlessness. Understanding where bargaining strength is eroding, and where it is not, helps professionals target states and districts where union representation still delivers meaningful salary premiums, job protections, and professional development support. Pursuing a master's in teacher leadership can equip educators with the skills to advocate effectively regardless of union density. Recognizing the rise of non-union advocacy also opens doors to alternative forms of professional influence. Rather than reacting to change, educators who track these developments can make proactive career moves that align with their values and long-term goals.
Frequently Asked Questions: Teacher Unions and Education Careers
Teacher union strength varies widely across the United States, and the implications for educators' careers are significant. Below are answers to the most common questions teachers and aspiring educators ask about unions, pay, and career planning in 2026.
Where you teach is now a measurable union decision, not just a geography call. The 2026 Fordham report validates what many educators suspected: states with top-ranked unions like Vermont, California, and Massachusetts consistently pay more and retain teachers longer. This is not a coincidence; collective bargaining drives salaries and working conditions.
If you are pursuing an M.Ed. or certification, bookmark that ranking. Cross-reference union strength with BLS wage data for your target states. Educators weighing affordable M.Ed. options should factor state union climate into the equation alongside tuition. In 2026, union strength is a career signal you cannot afford to ignore.